 An official website of the United States government.
  Official websites use .gov
A .gov website belongs to an official government organization in the United States.
Official websites use .gov
A .gov website belongs to an official government organization in the United States. Secure .gov websites use HTTPS
A lock or https:// means you’ve safely connected to the .gov website. Share sensitive information only on official, secure websites.
Secure .gov websites use HTTPS
A lock or https:// means you’ve safely connected to the .gov website. Share sensitive information only on official, secure websites.High quality satellite imagery is available for use at no cost, offering scientists an inexpensive opportunity to monitor changes to coastal wetlands throughout the year. However, cloud cover can prevent some sensors from capturing information or result in a blind spot over part or all of a region (Figure 1). A NOAA-funded study has revealed that using observations from multiple satellites over the course of a month, a more complete picture of the coastal wetland conditions in a study region can be offered, even if partial observations are obtained by multiple surveys.
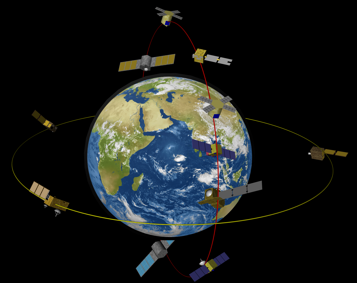
Idealized concept of a virtual satellite constellation. Credit CEOS Ocean Colour Radiometry Virtual Constellation.
Coastal wetlands (i.e., marshes) are valuable ecosystems due to their role in coastal protection from flooding, water purification, carbon sequestration, erosion control and as a habitat and a food source for many species. A major purpose of models that predict future coastal wetland extent and condition is to inform best management actions to maintain or increase these values. One of the most reliable sources of coastal wetland proximity and health comes from satellite imagery, with observations extending back to 1972 for some satellites (i.e., Landsat). One of the most successful approaches to identify vegetated areas and their condition from satellite observations, as a proxy from their level of solar radiation is the Normalized Difference Vegetation Index (NDVI).
As green plants absorb solar radiation to complete photosynthesis, they also emit solar radiation that can be observed by satellite sensors. Using the spatial and temporal changes in vegetation indices’ like NDVI, it is possible to understand how gradual events like drought or punctuated changes like hurricane storm surge impact coastal wetlands. The project team used this approach to investigate the impact of hurricane and drought on both freshwater and saltwater wetlands from year 2000 to 2015 in Apalachicola Bay (Tahsin et al., 2016).
The new publication describes a “Virtual Constellation” approach using random forest machine learning techniques for integrating observations and their associated NDVI from multiple satellite sensors (I.e., Sentinel 2A MSI, Landsat-8 OLI, and ASTER). They tested the approach on 5 years of observations, over the Apalachicola region (FL), including NOAA’s Apalachicola National Estuarine Research Reserve (NERR). The virtual constellation assimilates all data to be compatible with Landsat-8 (the sensor with the longest lineage) resulting in gains in NDVI coverage for 2 sample months (February 2018 and September 2016) of 48.1% to 100% and 33.75% to 70.86% (Figure 1), respectively.
The virtual constellation approach allows for more complete NDVI observations at monthly intervals for our coastal wetland ecosystems. This allows for better understanding of the baseline conditions and the impacts of human and natural disturbances to our coastal wetlands. This in turn can inform best management actions to ensure our coastal wetlands survive despite sea level rise and other climate impacts. Finally, this project adds value to existing satellite missions by creating more complete NDVI from completed missions and provides economic justification for future projects.
The study is part of the project Dynamic Sea Level Rise Assessments of the Ability of Natural and Nature-based Features to Mitigate Surge and Nuisance Flooding, supported by the NCCOS Effects of Sea level Rise Program (ESLR).
Citation: Tahsin, S.; Medeiros, S.C.; Singh, A. 2021. Consistent Long-Term Monthly Coastal Wetland Vegetation Monitoring Using a Virtual Satellite Constellation. Remote Sensing 13(3), 438. https://doi.org/10.3390/rs13030438
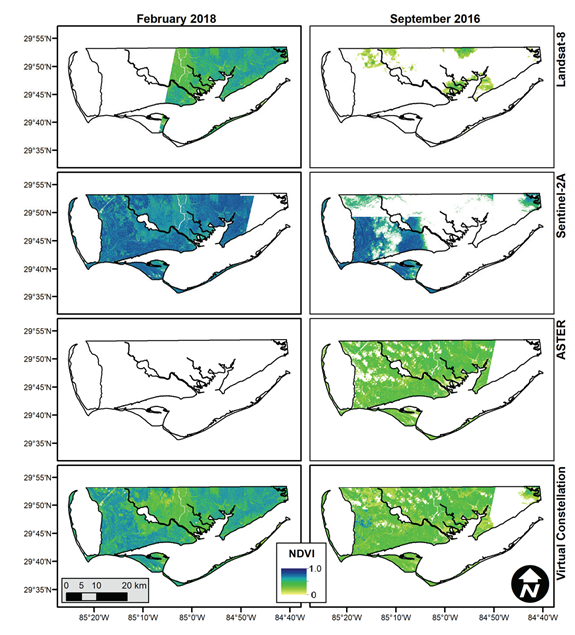
Figure 1. Image recreated from Tahsin et al. 2021. Gaps in coverage due to satellite coverage can be seen for two dates by three NDVI. Virtual Constellation performance by combining multiple indices, can be seen for February 2018 and September 2016. White pixels in the project area indicate information loss due to clouds, shadows, or scene missing in that month. Gains were observed from 48.1% coverage to 100 % (02/2018) coverage and 33.75% to 70.86% coverage (09/2016).