 An official website of the United States government.
  Official websites use .gov
A .gov website belongs to an official government organization in the United States.
Official websites use .gov
A .gov website belongs to an official government organization in the United States. Secure .gov websites use HTTPS
A lock or https:// means you’ve safely connected to the .gov website. Share sensitive information only on official, secure websites.
Secure .gov websites use HTTPS
A lock or https:// means you’ve safely connected to the .gov website. Share sensitive information only on official, secure websites.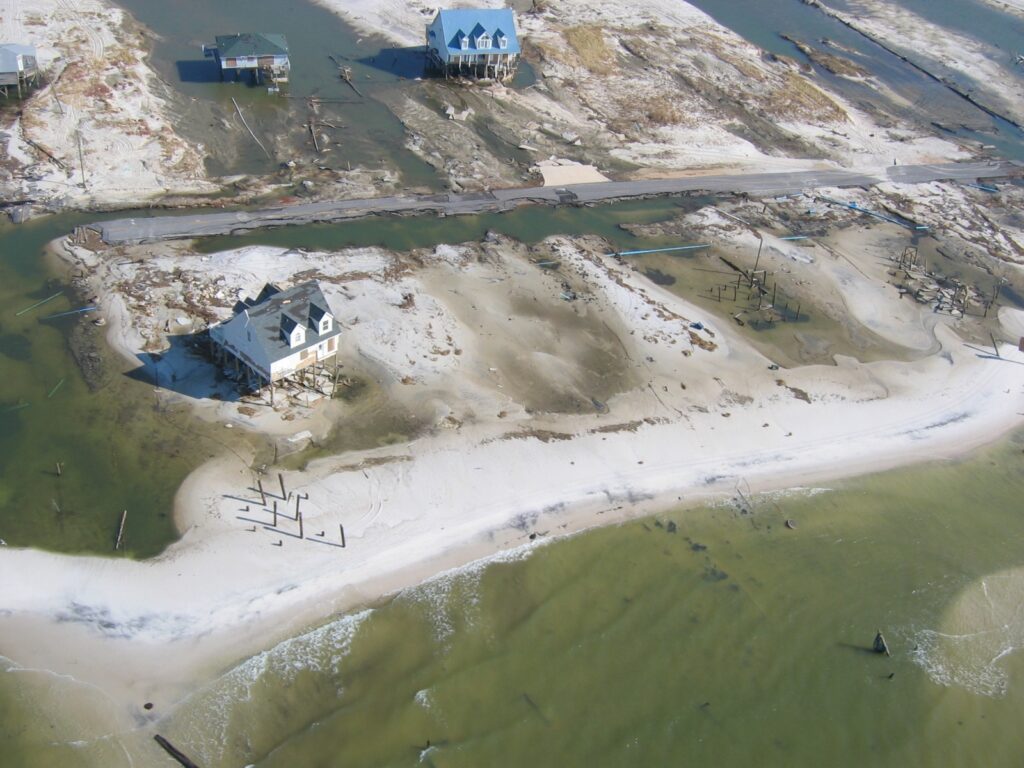
Hurricane Katrina's storm surge caused significant damage to beachfront homes on Dauphin Island, Alabama. Credit: NOAA.
A new way to explore and visualize the science and future effects of sea level rise is now available in the form of two story maps! The story maps detail the NCCOS Ecological Effects of Sea Level Rise (EESLR) project in the Northern Gulf of Mexico, identifying future coastal wetlands and storm surge under various scenarios of sea level rise. Using results from an NCCOS-funded team at Louisiana State University and the University of South Carolina, and developed through a collaboration of NCCOS scientists and the Northern Gulf of Mexico Sentinel Site Cooperative, the story maps target local stakeholders to communicate project results and provide access to data. In addition, both story maps feature key findings through an interactive viewer and provide examples of potential data uses to address local management issues.
Products result from dynamic modeling that takes into account interactions between both the physical and biological environments. The storm surge model combines elevated sea levels with changes in shorelines, tides, marshes, and anticipated increases in coastal development. For the marsh model, patterns of tidal flooding into a marsh combine with sediment data and plant response to simulate how marshes evolve with sea level rise. The result more accurately captures the physical and environmental changes that will occur with sea level rise than static, or bathtub-like, models shown in other sea level rise mappers.
Using “what if” examples for Hurricanes Katrina and Dennis, the storm surge story map simulates future potential sea level rise scenarios for storm surge in the northern Gulf of Mexico. It also depicts the cumulative impacts of surge (maximum of maximums) from 10 storms and a recalculation of one percent annual chance flood event stillwater extent and depth under future conditions. The story map also provides an example of how the data can be used to evaluate future vulnerability of critical infrastructure, such as school, hospitals, and emergency facilities, to storm surge. The coastal wetland story map focuses on the Apalachicola, Weeks Bay, and Grand Bay National Estuarine Research Reserves and highlights advances in predicting wetland vulnerability to sea level rise based on dynamic biological and physical processes.
These story maps are the culmination of extensive transdisciplinary research on the effects of sea level rise in the Gulf of Mexico. Moving forward, these data and modeling tools are now informing assessments of how natural and nature-based features can be used to protect coastal areas from storm surge and nuisance flooding as part of a recently funded EESLR project.
For more information contact Christine.Addison@noaa.gov or David.Kidwell@noaa.gov.